For more than a decade, the value of the pitcher win statistic has been debated between the analytic and traditional schools of thought. There is perhaps no stronger proponent of eliminating the win statistic than Brian Kenny. In 2016, the MLB Network Analyst and host of “MLB Now” wrote a book titled Ahead of the Curve: Inside the Baseball Revolution. In it, he challenges the use of traditional statistics and encourages fans to think critically about which statistics we rely on to evaluate team and player performance. One of his arguments is that the pitcher win statistic became irrelevant a long time ago; that it could go away completely, and we wouldn’t even notice it was gone. He dedicated an entire chapter to the topic, calling it “Kill the Win”. The #KillTheWin movement had gained a following a few years before Kenny’s book was published and continues to be the stance of analytic-minded fans. Kenny lays out a convincing case detailing the flaws in using pitcher wins-losses to evaluate pitching performance.
The Problem
The criteria to qualify for a win cause the stat to be too random and ultimately a poor gauge of a pitcher’s actual performance, yet it’s been used as the basis for elections to the Hall of Fame, All-Star selections, and Cy Young Award voting. Take a look at the Chicago Cubs’ top fifteen all-time leaders in wins as an example. Most pitchers in this list aren’t even in the same zip code as the top fifteen when ranked by FIP (Fielder Independent Pitching) or ERA (Earned Run Average).
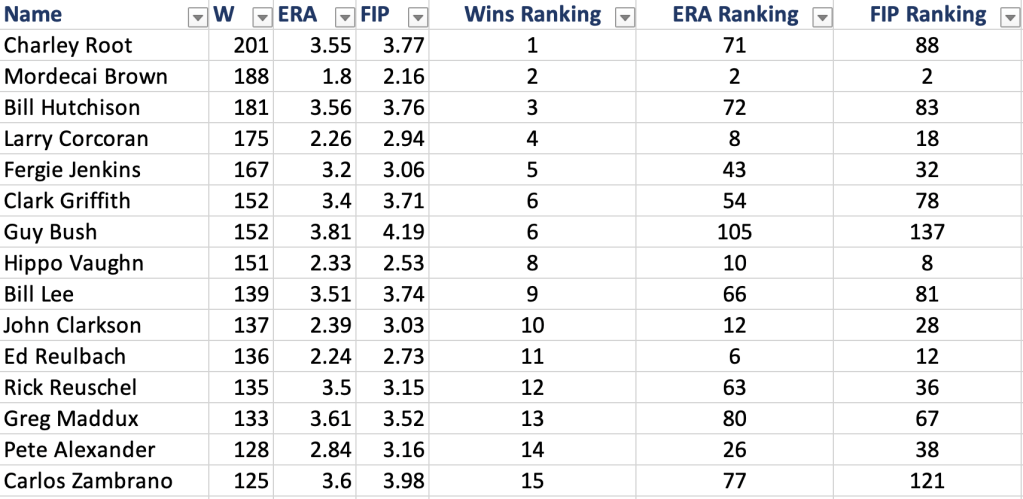
Carlos Zambrano may not be a top-15 Cubs pitcher in ERA or FIP, but he’s easily top-15 in temper tantrums. And below are the 2021 MLB wins leaders and their corresponding ERA and FIP rankings:

The Cubs all-time wins leaders and the 2021 MLB wins leaders examples show that a high number of wins doesn’t mean a pitcher was effective over the course of a season or his career. Corbin Burnes of the Milwaukee Brewers led the league in ERA and FIP but was only 22nd in total wins. Kyle Hendricks tied for the sixth most wins in the MLB last season, but his ERA and FIP were 36th.
The pitcher win is rooted in tradition. The concept of assigning a win to the winning team’s pitcher was first introduced to the game in 1884 and by 1950 the five-inning minimum became official. The stat has been popularized by broadcasters, journalists, and others around the game for nearly 140 years. Many pitchers have entered the Hall of Fame in part because of their accumulated wins. My favorite player of all-time, Greg Maddux, entered the Hall of Fame in 2014 largely on the back of his 355 career wins. I agree that the pitcher win in its current form is useless in evaluating pitchers, but I can also understand how completely axing it from the game could feel like an overcorrection that doesn’t need to be made. What if instead of #KillTheWin, we #RethinkTheWin? Can we resuscitate the pitcher win statistic by using new criteria that fit the 2022 version of the game instead of the 1950 version? My proposal is using Win Probability Added (WPA). The nature of this statistic makes it a great fit to assign pitcher wins. It’s not perfect, but WPA still makes a lot of sense for this purpose. Using WPA as a basis for pitcher wins would improve the validity of the stat to a point where fans who are critical of it in its current state may not completely dismiss it and fans who think traditionally about pitcher wins could accept this modernization of the stat.
The Solution
About Win Probability Added (WPA)
Win Probability Added (WPA) measures changes to a team’s Win Expectancy (WE) and assigns those changes in percentage points, both positive and negative, to individual players whose actions impacted their team’s WE. Win Expectancy is recorded at the team level and Win Probability Added is specific to each player. WPA applies to both hitters and pitchers. If a hitter belts a go-ahead home run in the seventh inning of a game, his team’s WE has increased due to that hitter’s action, so the hitter gains the WE percentage point increase associated with that home run in the form of Win Probability Added. That action by the hitter also inversely affects the pitcher’s WPA because the home run reduced the pitcher’s team’s win expectancy by the same amount.
Each game starts with each team having a 50% chance to win, or a WE of 0.5. Think of that as the baseline. Each play throughout the game will either push a team’s 0.5 WE closer to 1.0 or detract from their 0.5 WE baseline and pull them closer to 0.0 WE. By the end of the game, the cumulative WPA for the winning team (pitchers + hitters) will add up to 0.5 and the total WPA for the losing team will add up to -0.5. Therefore the calculation for the winning team will be the baseline 0.5 WE + 0.5 cumulative WPA through each positive outcome in the game to equal 1.0 or a 100% Win Expectancy. The losing team experiences the opposite: the 0.5 WE baseline minus 0.5 cumulative WPA through each negative outcome to equal 0.0 or a 0% Win Expectancy. A drawback of the stat is that fielding errors count against a pitcher’s WPA because the opposing team’s win expectancy increased while that pitcher was on the mound. It doesn’t take into account that the pitcher didn’t cause the fielding error. Non-pitching players can only affect their WPA at the plate; their performance as defensive players does not impact their WPA. Here’s an example box score from FanGraphs that includes WPA from the Cubs’ April 14th win at Colorado:
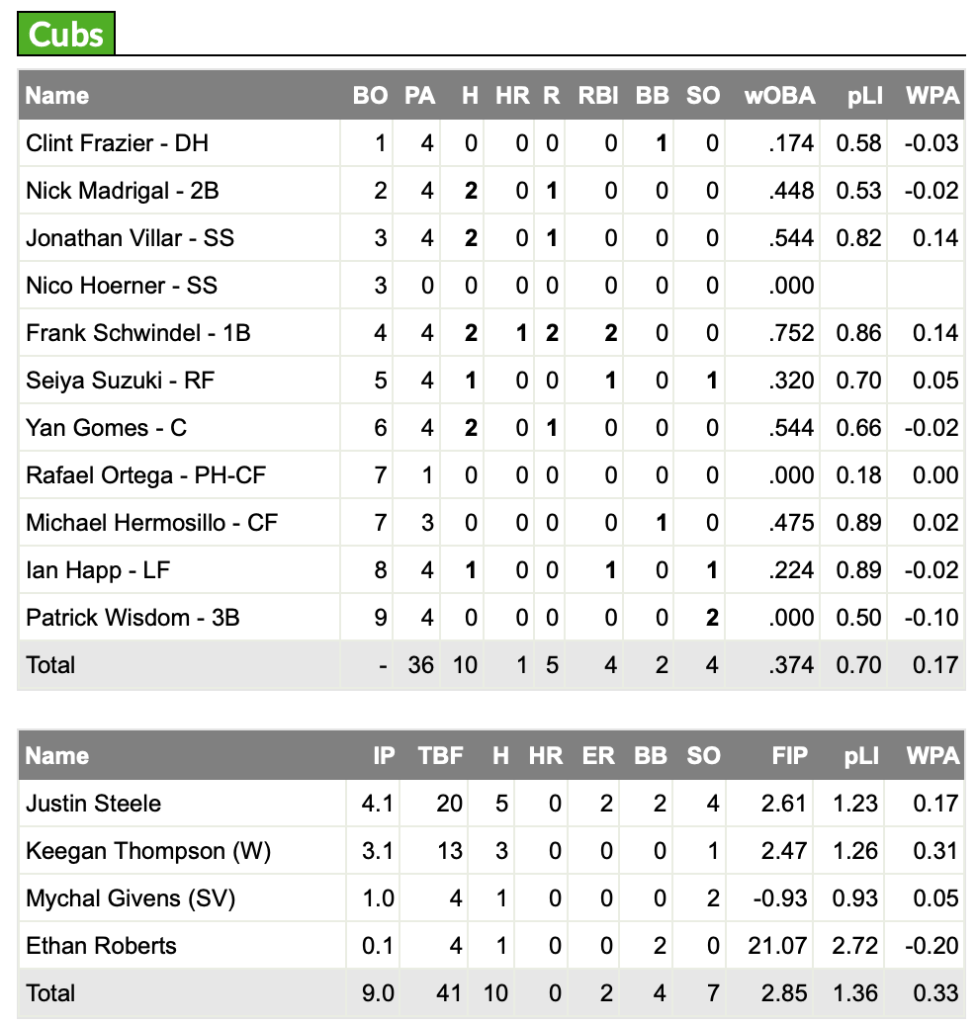
The way to interpret each player’s WPA is by saying the player added x% to his team’s WE. In the box score above, Keegan Thompson added 31% to the Cubs’ WE during his 3.1 IP performance. Frank Schwindel and Jonathan Villar each added 14% to the Cub’s WE. These players receive those WE percentage changes as Win Probability Added.
WPA is tracked additively throughout the course of the season, so you can view players’ WPA totals as the season progresses. But since we’re applying WPA in the context of a pitcher win, we’re only concerned with each pitcher’s WPA through the course of one game. FanGraph’s Sabermetrics Library article on WPA characterizes WPA as a descriptive statistic and not a predictive one. For our purposes, that’s perfect. We don’t need WPA to predict a pitcher’s chances of winning future games, we just want to use it to describe a pitcher’s impact to individual games in the form of wins or losses. Per FanGraphs, “It doesn’t tell you how well a player performed, it tells you how important their performance was.” How important a pitcher’s performance was in the context of one game is exactly how we should assign pitcher wins and losses. WPA tells us who the biggest contributors were to a team’s wins or losses. It’s clear, simple, and data-driven.
The Impact
This change is most likely to affect two types of pitchers: starting pitchers who usually throw the most innings of a game and back-end bullpen pitchers who tend to enter games in high leverage situations that have high impact on WE. We have a few examples from recent Cubs games to illustrate how the WPA-based win would have changed pitching win decisions.
Scenario 1: Starting Pitcher who earns the win under current qualifications doesn’t get the win under the new WPA win design
If WPA is used to assign pitcher wins, it’s probable starting pitchers would earn a couple fewer wins per year than under the current win qualification. That is due to nature of when back-end bullpen pitchers enter games. The seventh, eighth, and ninth innings of games are high leverage situations that have a high impact on a team’s WE.
I reevaluated Kyle Hendricks’ 2021 season and reassigned win-loss decisions based on WPA data from each start he made. Hendricks finished the 2021 season 14-7. Under a WPA win format, his record would have been 10-7. In all four games, the reliever would have come away with both the win and the save. In back-to-back starts in June, Hendricks got the win when he had the lowest WPA of any Cubs pitcher in each of those games. That feels like a missed opportunity to assign a win to a pitcher who contributed more to the Cubs’ wins in those two games.
| Date | Opponent | Decision | WPA Decision | Comments |
| May 27, 2021 | @ Pirates | W | ND | Tepera would get the win and the save. Hendricks had the second highest WPA this game. |
| June 01, 2021 | vs. Padres | W | ND | Kimbrel would get the win and the save. Hendricks had the lowest WPA of all Cubs pitchers this game, but still got the win. |
| June 06, 2021 | @ Giants | W | ND | Kimbrel would get the win and the save. Hendricks had the lowest WPA of all Cubs pitchers this game, but still got the win. |
| August 17, 2021 | @ Reds | W | ND | Heuer would get the win and the save. Hendricks had the second highest WPA this game. |
Scenario 2: Starting Pitcher doesn’t get the loss under the new WPA win design
Unfortunately for starting pitchers, losses are probably less likely to be affected. If a starter puts his team behind in a game by giving up runs in the first half of the game, he’s likely to have the lowest WPA (a negative number in this scenario) if the game results in a loss for his team.
Looking back at the Cubs’ combined no-hitter from June 24, 2021 in Los Angeles against the Dodgers, we have an example of this using the Dodgers’ pitching staff. Dodgers starter Walker Buehler got tacked with the loss after throwing 6.0 IP and giving up three earned runs, leaving the game trailing 3-0. He finished with a negative WPA of -0.05. David Price then entered the game in the seventh inning in relief for the Dodgers. He faced four hitters without recording an out and gave up one earned run. The Cubs increased their lead from 3-0 to 4-0 without giving up an out in the seventh inning. The combined outcomes of those four plate appearances against Price increased the Cubs’ win expectancy by 0.08 points, which means David Price had an equal but inverse WPA of -0.08. From a win expectancy perspective, David Price’s relief appearance did more to put the Dodgers at a disadvantage than Walker Buehler’s start. Yet Buehler got the L.
Scenario 3: Starting Pitcher gets the win without throwing 5 IP
Drew Smyly might be in favor of the WPA win after his outing on April 17 in Colorado. The Cubs lefty was pulled after 4.2 IP after getting into a little bit of hot water in the fifth inning. Of course under the current win qualifications, Smyly didn’t qualify for the win because he didn’t complete five full innings. Under a WPA-based win qualification, he would have earned the W. His 4.2 IP, four hit, four strikeout, 0 earned run performance earned him a 0.21 WPA. Rowan Wick received the win with a 0.11 WPA, tied for third best on the Cubs’ pitching staff that day.
Removing the innings-pitched minimum for pitcher wins is overdue. A version of an innings minimum for assigning wins was first mentioned in 1890 and the five-inning minimum became official in 1950 and for some reason, still exists in 2022. If a starter was the most important pitcher in his team’s win, he deserves the win regardless of being able to complete five full innings to start the game. In an era of pitch limits and using bullpen pitchers as Openers, the five-inning minimum doesn’t have a place in the modern game.
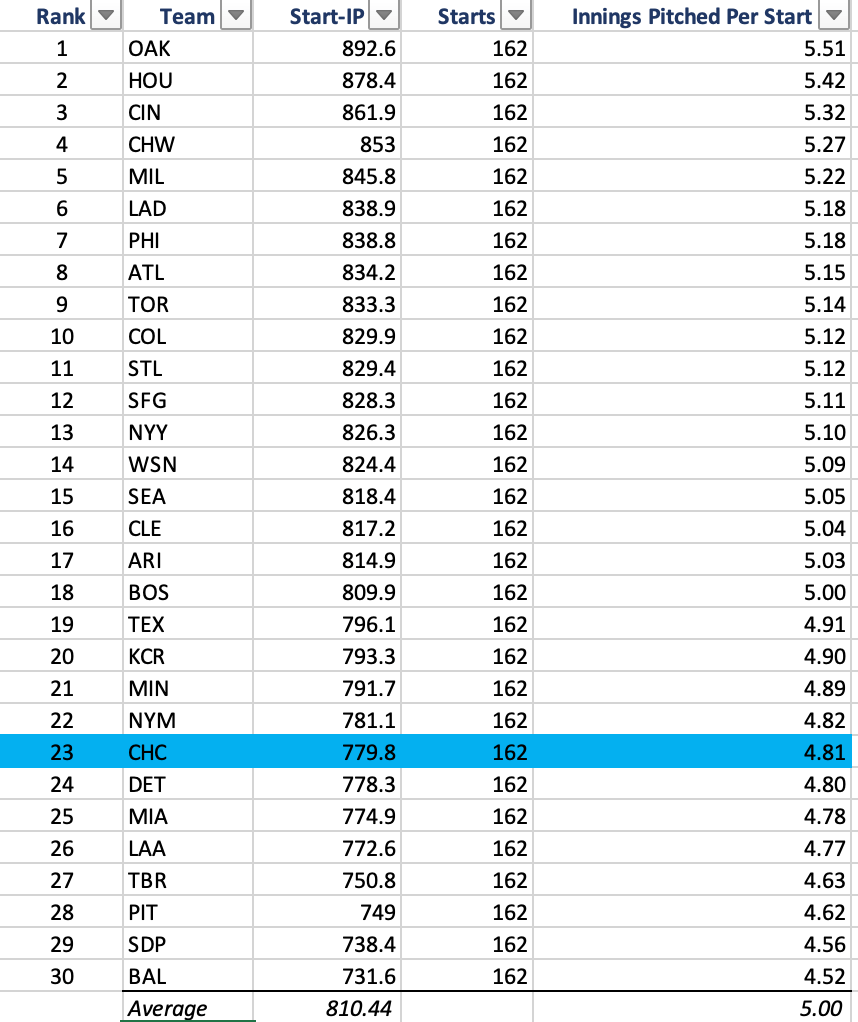
The average number of innings pitched per start has been a popular topic as teams continue to experiment with different types of pitcher usage. By 2021, the average number of innings per start dropped to 5.00, meaning the average start is right at the bare minimum required to earn a win. It’s conceivable to think the five-inning minimum qualification for a win is propping up that average, and if it didn’t exist that we would already see the league average below 5.00 innings pitched per start. Without the five-inning minimum, managers could decide to pull their starters before 5.0 innings pitched more often and their guy could still earn the win. The Cubs were already below that threshold in 2021.
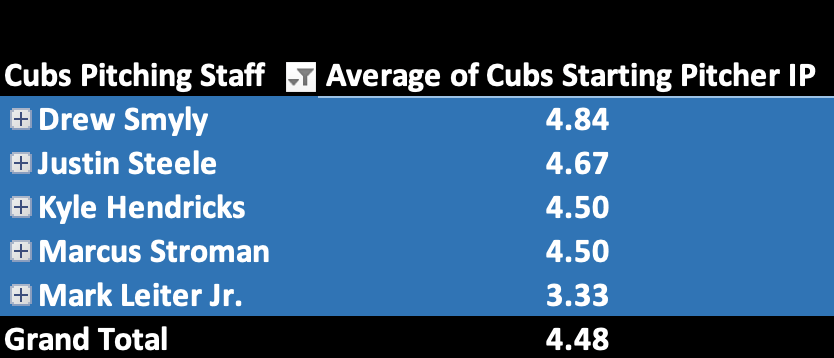
Through nine starts in 2022, Cubs starters are averaging 4.48 IP per start. That’s being dragged down a bit by Mark Leiter Jr.’s spot start, but that’s what we get with a small sample size of nine games.
Scenario 4: Official Scorer assigns the win based on perceived “effectiveness”
In situations where the starting pitcher doesn’t complete five innings pitched, leaves with the lead, and that lead is never relinquished, the official scorer of the game gets to decide who the most “effective” relief pitcher is and assign the win to that player. This is all stated in rule 9.17 of the Major League Baseball rulebook. There is a specific comment on rule 9.17 that provides detail on how the official scorer can determine who the most effective pitcher is.
This actually happened in the Cubs’ 5-4 loss to the Brewers on April 10. Starter Freddy Peralta left the game with a 3-1 lead after 4.0 IP. Brad Boxberger was originally credited with the win, but the Cubs’ official scorer rescinded that win, citing rule 9.17, and gave the win to Jake Cousins.
Here’s the problem with that: Cousins threw two wild pitches and allowed the tying run to score. As you probably guessed, that reflects negatively on his team’s WE and Cousins’ WPA. Cousins reduced the Brewers’ chance to win the game by 12% and he had the second-lowest WPA of all six Brewers pitchers that day. But an arbitrary decision from the official scorer based on rule 9.17 gave this objectively ineffective pitcher a win. This type of situation isn’t frequent, but assigning a win like this takes away from any value the win still has left.
The Summary
As the stat is currently constructed, a win for a starting pitcher can be defined as the number of times the pitcher threw at least five innings, left with the lead, that lead was never relinquished, and his team won. That’s a clunky definition and isn’t very descriptive of his importance to his team’s win. If we shift to a WPA-based pitcher win, we could define a win for any pitcher as the number of times the pitcher added the most points to his team’s win expectancy. That’s a clean, clear definition that applies to all pitchers, not just starters. Win Probability Added tells us the story of which players contributed most to a team’s win. It’s perfectly fair to give a win to the pitcher who added the most to his team’s win expectancy. Revamping the pitcher win by using WPA doesn’t make accumulating wins a new revolutionary stat and it still shouldn’t be used as the basis for prestigious awards, but it at least bases it on a fair, measurable statistic without arbitrary rules like an innings-pitched minimum or “effectiveness” as determined by an official scorer. #KillTheWin? Maybe it’s not quite time for that. Yet. But this is a logical path forward to modernize a traditional stat.
